The weekly chart shows a possible ZZ pattern.
 |
| NZDUSD - weekly chart |
 |
| NZDUSD - daily chart |
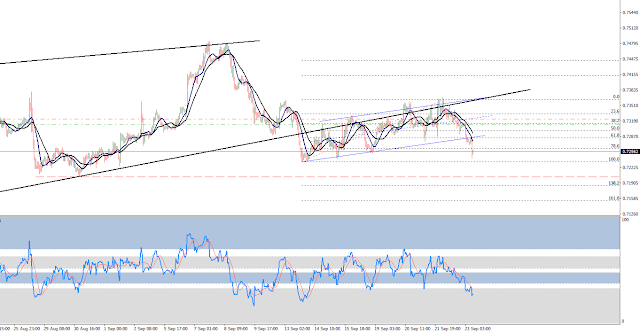
The structure is not yet confirmed, but there are some sings of a trend reversal:
- The price reached the top line of the corrective channel.
- Wave C looks like an ending diagonal in accordance with rule of alternation.
- There is a bearish divergence on the weekly time frame.
- The RSI on the weekly time frame has not reached the sustainable bull zone yet and toped at the limit of the bearish support zone.
- The lower trendline of the ED is pierced and getting tested right now.
- The price action retrace 50% of the drop from the 0.748. This may be enough for a wave ii or b.
There are some counter sings as well:
- The MA10/20 channel on the weekly chart can still provide support.
- The momentum of the daily time frame reached the sustainable bull zone for a period and dropped back to bullish support, then the pull backed to a level a break down can only be anticipated and confirmation is needed.
- Structure of the correction on the 1 hour time frame may unfold into a flat pattern.
- one crucial item is still missing from my check list. No critical support has been broken so far. The first key level for the bears is 0.72, but the level of wave (iv) of C (0.695) is the most important.
 |
| NZDUSD - 4 hours chart |
I opened a short on a hook setup on the 1 hour time frame. The setup was supported that both bull and bear scenarios need (bear) or tolerate (bull) a new local low. The maximum level of this mutual road for both side lays around 0.714 and may be 0.71 in respect that the price action is still above the most support important level, thus I can't rule out that wave iv of C is labeled incorrectly on the weekly chart.

No comments:
Post a Comment