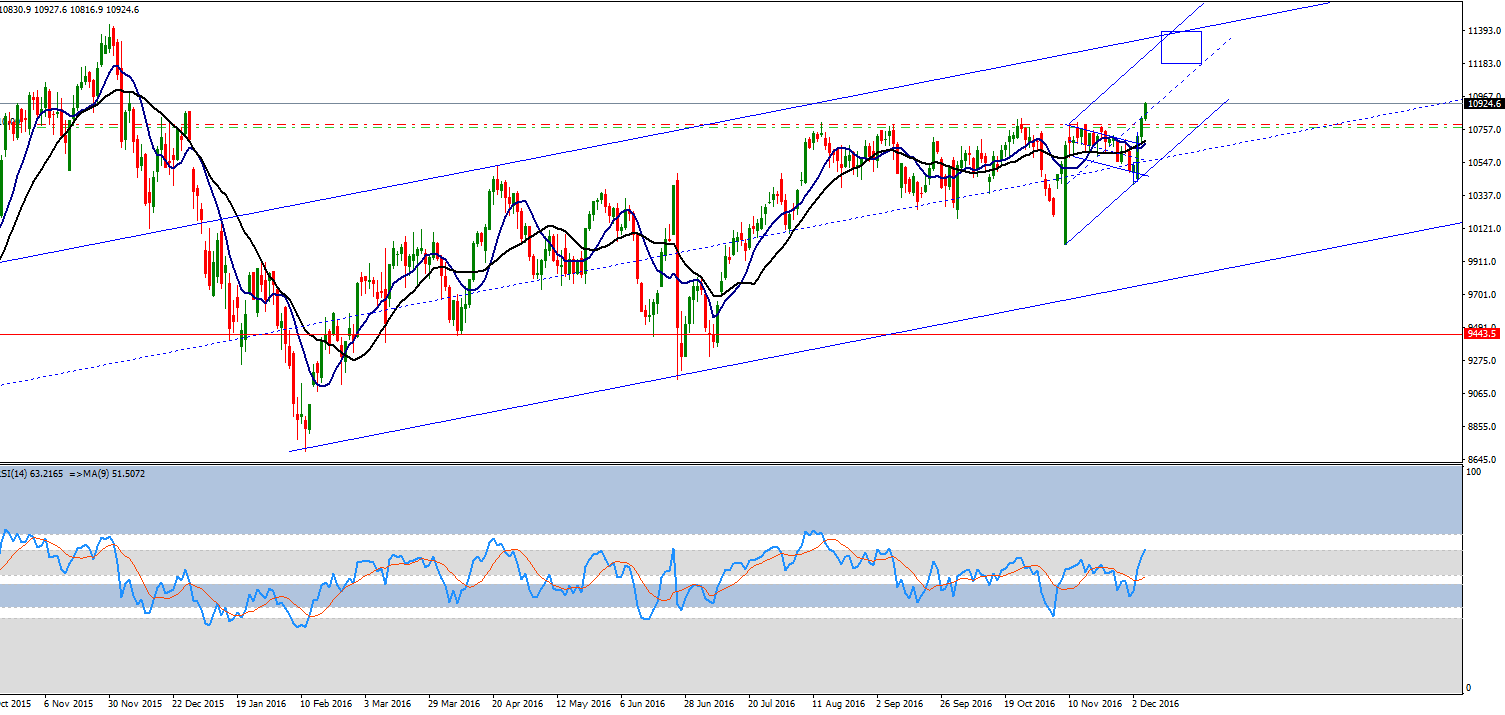
Wednesday, December 7, 2016

DAX - 07/12/2016

The top of the range got pierced and this suggests that the market is most likely on its way to the target zone of the daily time frame  as C of (Y). Right now my primary wave count is that the DAX will make a [iii] of C that will ideally end around 11500-11600.  Top lines of the parallel channels should behave as resistance, but if not, the bulls may go wild. I think now it's a good situation to hold the long position at least for a week or so.We'll see. 

DAX30 (CFD) - Daily chart
I opened my long yesterday at 17:06. The momentum on the 1 hour chart reached the sustainable bullish zone, and the structure of the rally suggested continuation. My context was set and there was a continuation signal candle on the 15 minutes chart.

Tuesday, December 6, 2016

DAX - 06/12/2106

Update: 17:16
SL closed my short @ 10730,5. Looks like the bulls are still on the run.

Monday, December 5, 2016

Monday, November 14, 2016

DAX - 01/12/2016

Update: 14:27

Lowered my Sl @10569. MA10/20 channel should be resistance.

DAX30 (CFD) - 15 minutes chart

DAX - 14/11/2016

The rally from the lower part of the range has already reached the top of it. My long position got sopped out @ 10350. I expected a lower pull back before getting back to rally mode.

Now it is neutral that price action slows down a bit in a bullish interpretation as well. So I decided to open a counter-trend short position on a possible bull trap situation. EP was @ 10766. My context time-frame for this setup is the 15 minutes chart and BeSS signal was on the 5 minutes chart. This wave [C] (of (2)?) could easily form a running pattern and thus missing my target zone by a lot. That is why I manage my short with a relatively tight trailing SL. Sl right now @ 10730. Of course I cannot rule out that the local top might be part of a bigger bull trap, but my primer wave count of the market is bullish and I expect at least a C of (Y) wave ideally to the 11200 zone.

DAX30 (CFD) - 15 minutes chart

DAX30 (CFD) - Daily chart

Wednesday, November 9, 2016

DAX - 09/11/2016

The gap down reached the support line of the previous corrective channel, then the market started to rally right away. The range on the daily and weekly chart is still intact in my opinion, but the movement from the middle of August may be a completed complex (most likely) flat correction. My context remained the same until this range is still intact. Today's daily candle will be crucial. If it will be a full body bullish candle, then the bullish continuation is likely, especially that the momentum reached the support zone.
DAX30 (CFD) - weekly chart - Market is testing upper line of the parallel channel 


I opened a long this morning at 8:16 (GMT+2) with  EP @ 10108. Right now I managing with a mechanical candle trailing stop on the 15 minutes chart. SL@10302. My plan is to scale out at the top of the range, around 10575. We'll see how this is going to pan out. If the range gets broken down then I will start to think of a bigger downside movement which may aim the next support zone (9200).

DAX30 (CFD) - Daily chart - Correction may be completed but range is still intact.

Tuesday, October 11, 2016

NZDUSD - 11/10/2016

 It looks like the decline of the Kiwi continued from last week and aiming 0.695 critical support level. The drop from the 0.784 top so far looks like a three wave pattern. Funny thing is that above 0.695 I cannot rule out the correction because the Fibonacci 161.8 expansion level (usual expansion of a wave 3) is right there. 
NZDUSD - Daily chart

Last Friday's price action looks like a nice pause on the daily time frame. The bulls failed to make a reversal. Yesterday there was bearish slingshot momentum configuration setup on the 1 hour chart, which was followed by a nice signal candle. The slingshot was a strong 8 candle setup and occurred in lower blue zone which is the first support zone in a bear trend.

NZDUSD - 1 hour chart
This setup offered high return with low risk. I opened a short position at 18:18 (GMT+2). EP was @ 0.7133 Sl was 0.7149 (above the left leg of the slingshot). My first target zone is 0.701. This is very I plan to scale out 1/3 of the position. If the decline continues to the 0.695 support level I will scale out another 1/3 of the position.

NZDUSD - 4 hours chart
The higher time frames also supported this bearish setup.  The momentum of the 4 hours chart reached the sustainable bearish zone and pull back only pushed the RSI up to the first bearish support zone. After the setup got triggered the market kept declining and reached a new low. I pulled my Sl lower to 0.7115 which is just a little bit below of what I think is wave [1] of (v) of [iii].

Friday, October 7, 2016

NZDUSD - 07/10/2016

My short position got stopped out @ 0.7177 with +107 pip. 

NZDUSD - 4 hour chart
 
The kiwi pierced below the mutual target zone (marked with small blue rectangle) and reversed from there. Until this moment both bear and bull scenario pretty much had the same road. Now the NZDUSD reached an intersection and most likely we'll see the direction in the next 1 or 2 weeks. I decided to rule out the complex flat scenario on the 4 hours time frame mentioned in my earlier posts. 

So my bearish version suggests that an ending diagonal pattern in wave C position is completed and a price will turn down to at least 0.632 level. My (down to earth) bullish version says that the ending diagonal is incomplete and the decline from the 0.784x top is a correction and a new high will come.

It's important to note that the price only break below the first support level of 0.72 and looks like the market is testing it right now. The key level still lays around 0.697X. The momentum of the daily time frame is at the bullish support zone, but I think the bulls lack the support of the higher time frames and below the daily time frame the momentum looks really bearish. Thus I will prefer the bearish context and next week I will try to seek signaled short setup if the PA stays below the 0.731 high.

Thursday, October 6, 2016

NZDUSD - 06/10/2016

The kiwi reached the lower line of the small rectangle which marks the zone where reversal may occur. I can't see any reversal signal so far, but I decided to lower my stop loss order. The decline on the 1 hour time frame switched to channel mode after a nice sharp drop. The RSI on the 1 hour chart ( and also on the 15 minutes time frame) turned down from bearish support. 
NZDUSD - 4 hours chart
NZDUSD - 1 hour chart

Wednesday, October 5, 2016

NZDUSD - 05/10/2016

I still think that the Kiwi is more likely creating a ZZ pattern as I mentioned in my previous post.
NZDUSD - Daily chart

Some items from the cons and pros list is checked. First of all the top line of the corrective channel behaved as a resistance. The price action on the weekly and daily chart is still form a wedge, EWP wise it looks like and ending diagonal pattern. The test of the lower line was successful. 

The RSI on the weekly time frame has not reached the sustainable bullish zone and toped at the limit of the bearish resistance zone, while the daily RSI reached the sustainable bullish zone for one period and turned down and right now at the bullish support. The momentum of the 4 hours time frame looks bearish to me. All local low reached the sustainable bearish zone while the pull backs stopped in upper grey zone.

NZDUSD - 4 hours chart
The first bigger support level is pierced while last week the price was above it. Although I still cannot rule out that a strong pull back may come in a bearish scenario as well. I marked a small rectangle which is the maximum zone of a complex flat correction. Below this zone I can only think of one immediately bullish scenario. The 1-2-i-ii patterns sometimes form a triangle. So the correction from 13th of September until the 4th of October formed a triangle. Triangle can only be in wave IV, X or B position. So if this is an actual triangle patter then the price should reverse from the lower zone of the small rectangle. This would be and ideal price target for a thrust after a triangle pattern. This scenario may be ruled out below 0.7050. So reversal above 0.714  would suggest at least a strong pull back to 0.737 or that the ending diagonal pattern is most likely incomplete and a new high is still needed. We'll see...


Friday, September 23, 2016

NZDUSD - 23/09/2016

The weekly chart shows a possible ZZ pattern. 

NZDUSD - weekly chart

NZDUSD - daily chart
The structure is not yet confirmed, but there are some sings of a trend reversal:
  • The price reached the top line of the corrective channel. 
  • Wave C looks like an ending diagonal in accordance with rule of alternation. 
  • There is a bearish divergence on the weekly time frame.
  • The RSI on the weekly time frame has not reached the sustainable bull zone yet and toped at the limit of the bearish support zone.
  • The lower trendline of the ED is pierced and getting tested right now.
  • The price action retrace 50% of the drop from the 0.748. This may be enough for a wave ii or b.
There are some counter sings as well:
  • The MA10/20 channel on the weekly chart can still provide support. 
  • The momentum of the daily time frame reached the sustainable bull zone for a period and dropped back to bullish support, then the pull backed to a level a break down can only be anticipated and confirmation is needed. 
  • Structure of the correction on the 1 hour time frame may unfold into a flat pattern.
  • one crucial item is still missing from my check list. No critical support has been broken so far. The first key level for the bears is 0.72, but the level of wave (iv) of C (0.695) is the most important.
NZDUSD - 4 hours chart

NZDUSD - 1 hour chart
I opened a short on a hook setup on the 1 hour time frame. The setup was supported that both bull and bear scenarios need (bear) or tolerate (bull) a new local low. The maximum level of this mutual road for both side lays around 0.714 and may be 0.71 in respect that the price action is still above the most support important level, thus I can't rule out that wave iv of C is labeled incorrectly on the weekly chart.


Wednesday, September 21, 2016

Dax - 21/09/2016

Update 15:34 (GMT+2)
I'm back for a little while, so I sum up in a short update why I opened long. 

The price action broke above the trendline of L/Hs with a nice gap up while making break out attempt at the same time and right now testing it's higher line. This channel break out attempt with a choppy price action from to low could suggest basically two things: it's either a diagonal (leading or ending cannot be determined yet) or a 1-2-i-ii series.  The momentum reached the sustainable bullish zone for 1 period only and droped back to the bullish support level. I think until the parallel channel holds the price action within the bulls may have more chance then the bears.

It's hard to rule out anything right now with this structure due to the fact that important news event will occur today. The gap is still open and the price dropped to an ideal structural retracement level. I manage my long with a close SL level. Right now @ 10438.


DAX30 (CFD) - 1 hour chart.


Tuesday, September 20, 2016

Trades - 20/09/2016

Update 18:20 (GMT+2):
Decided to close DJI30 short @ 18169 with +27 points.

Update 18:13 (GMT+2):
DJI30 short: Risk lowered. SL @ 18185.
DAX30 short: Risk lowered. SL @ 10400.
Put trailing stops on both.
Update 18:05 (GMT+2):
DJI30 short: Risk lowered. SL @ 18190.
DAX30 short: Risk lowered. SL @ 10404.
Update 17:45 (GMT+2):
DJI30 short: Risk lowered. SL @ 18200.
DAX30 short opened: EP@10424; SL@10426 (originally@10448); TP@10379.
DAX30 (CFD) - 15 minutes chart

Update 16:50 (GMT+2):
Risk lowered. SL @ 18205.

Update 16:35 (GMT+2):
Risk lowered. SL @ 18240.


Update 16:15 (GMT+2):
DAX long stopped out @ 10426 with +47 points.

DJI30 short opened.
DJI30 (CFD) - 1 hour chart

Update 14:32 (GMT+2):
SL raised to 10426.

Update 13:23 (GMT+2):
SL raised to 10400.

Monday, September 19, 2016

weekly outlook - 19/09/2016

I had a long weekend so I try to make up this absence. I'll try to post update on more instrument during the day.


DJI30:
The medium channel on the weekly chart so far held price above. EWP structural support is also approximately lays right here. It is key to the bull to keep the price above this support level, because if this support breaks impulsively then the price most likely will test the next support zone or may be even the lower part of the bigger parallel channel. It's crucial to note that the smallest channel is broken and the market may retest this right now, but this needs confirmation. The RSI not yet reached sustainable bull zone.
DJI30 (CFD) - weekly chart
The momentum of the daily chart reached the bearish zone then retraced to support zone. This shows me that the price action can easily fold into an impulsive wave and at least a breakdown from a bearish triangle can be expected if the pattern gets confirmed.

DJI30 (CFD) - daily chart
On smaller time frame the price action looks like it's forming a triangle which is not yet complete. Triangles can only be in wave 4, wave B or wave X position. But it's important to remember that 1-2-i-ii patterns can form that looks like a triangle as well. This is why it's important to wait out the break of the kex levels. This could  determine my context.
DJI30 (CFD) - 4 hours chart

Thursday, September 15, 2016

Trades - 09/15/2016

Update: 19:05
Kiwi stopped out at (16:48 gmt+2) 0.72822 with +11 pip.

Update: 14:45
Closed dax @ 10362 with -55 poitns.
Opened kiwi short @ 0.72934, sl@0.731

Update 11:45 (GMT+2)
Closed dax long @ 10383 with +19 points.
I opened a short @ 10383 ; sl@ 10413.
Possible bearish slingshot on 15 minutes chart.
Bad decision. Got stopped out almost immediately.
Reentered a long with a smaller position @ 10417 with a more loosened SL@10337 with TP@10555. Looks like the original context and setup might work out. This is my last try. If this gets stop out then I'll "bench" myself for today.

Update 10:50 (GMT+2)
KIWI long got stopped out. I broke even.

DAX30:
I opened a dax long position. The last support level (10320) is so far untouched. The drop is contained by a parallel downward channel. Corrections tend to end at the boundary line or at middle line of these parallel channel. The momentum on the daily time frame is still at support, while the price is right now still at the lower part of a bigger range. This is may be my last try for a long and I only aim the top of a smaller channel shown on the 1 hour chart. This is where the MA10/20 on the daily chart can be found at the moment. It's quite a delicate situation because channels pretty much can be drawn across the chart. The channel drawn from the high 10542 is still a resistance and the price may keep bouncing down from that line.

DAX30 (CFD) - Daily chart

DAX30 (CFD) - 1 hour chart

I have a KIWI long right now. I still have pretty much the same context as before. The downward channel behaved as resistance so far. I expect to pierce below the critical support zone then a test of this level should be in place.
NZDUSD - Daily chart

NZDUSD - 4 hours chart

Wednesday, September 14, 2016

Trades - 14/09/2016

Rest of my DJI30 long stopped out @ 18085 and DAX30 long was closed @ 10370.

Update: 18:01
DJI30 long was opened @ 18104. Scaled out 1/2 @ 18122. Sl raised to 18085.
DJI30 (CFD) - 1 hour chart
Update: 17:39
DAX Sl@10370

Update: 17:17
Sl@10365
DAX30 (CFD) - 15 minutes chart

Update:17:12
Dax long @10372, sl@10349.

Update: 17:07
Closed kiwi@0.73961

Update: 16:32 (GMT+2)
DJI30 reached top of the parallel channel. I decided to close @ 18151 with +61 point.

DJ30 (CFD) - 1 hour chart (small channel behaved as resistance so far)


Update: 16:22 (GMT+2)
All my positions got stopped out. I opened a DJI30 and another NZDUSD long. SLs set to break even.

DJI30 (CFD) - 4 hours chart

NZDUSD - 15 minutes chart

Update 13:20
I raised my kiwi sl to 0.758. Scaled out half @ 0.783
Opened another dax long@10424, sl @ 10415 now, tp@10495. I raised the sl on my other long as well to 10385. Picture will be uploaded later on.

I just made some mind adjustment on my last update yesterday. The context is still pretty much the same.
DAX30 (CFD) - 1 hour chart
I scaled out half my position at top zone of the mini range shown on the 15 minutes chart. This range needs to break for bullish continuation. The corrective channel of the yesterday's drop looks broken after a successful retest. Price must stay above 10350 to keep the short term bullish anticipation valid. 
DAX30 (CFD) - 15 minutes chart
I also have opened a long NZDUSD. I anticipate at least a retest of the local high, then ideally a breakout near to the 0.736 resistance zone. I plan to scale out around 0.730 if the bulls will continue to prevail.
NZDUSD - 1 hour chart

Tuesday, September 13, 2016

DAX30 - 13/09/2016

Update 18:15 (GMT+2):
My long got stopped out. I'm looking for a reentry on the long side if a setup will come up. The market dropped to an ideal Fibonacci retracement level and touched the lower line of the corrective channel. (This is what I wanted to realize with my short position.) This should be a good place to buy if a setup and signal will come along too. It's wait and see now, because if the smaller channel fails to provide support and breaks, then a new low can be expected and may trigger at least a wave [5] or may be even something bigger.
DAX30 (CFD) - 15 minutes chart


Update 16:36

Opened long@10433, sl@10405


--------

Closed position@10457

Sl@10470


Update 15:16 gmt+2:
Lowered my risk. Sl@10485


Update 14:46 gmt+2:
Opened a short @ 10467 sl@10500, tp@10405
For some reason I can't upload image from my cellphone. I'll try to upload when I'll be back at my desktop.


Update 13:22 gmt+2:
 The bounce from 10425 low looks corrective so far. New local low might come today.


Yesterday the market spiked below the 10350 (Fibo 1.618 expansion level) then failed to unfold into an impulse wave. This means that the range is still intact provided support for the bulls. Although now rules have been broken, this bounce right now doesn't look proportional in time or price with a wave [2].
DAX30 (CFD) - 1 hour chart.

I think the market will bounce back above 10600 level and will try to test the upper part of the range. The context in my reading is still open in either way. The weekly chart shows that this range is near the higher line of the corrective (or maybe base channel).

DAX30 (CFD) - Weekly chart.
If the market stays above yesterday's low then I think it has a high possibility that the DAX will at least make another L/H or maybe a new local low as part of complex corrective pattern. I will only start to think of a breakout if the weekly channel gets broken and tested.
DAX30 (CFD) - Daily chart.

DAX30 (CFD) - 4 hour chart.
The momentum of the daily time frame provided support for the price action while the RSI on lower time frames reached a state of climax yesterday. Summa summarum, at the moment I think it will be more likely to make profit with an intraday long signal and only expect a retracement. This would be a mutual road for both bullish and bearish interpretation. But if this support will fail hen I will start to think that the preceding price action was a (i)-(ii)-[1]-[2] situation.

Monday, September 12, 2016

Trades - 12/09/2016

Position got stopped out @ 10380 with -14 points. The signal faded and the setup failed. It was really busy at work today and missed the whole upside movement. I expected a bounce for wave [4] but this doesn't look like one, and on the DJI30  chart the market ruled out this interpretation. I'll update my context tomorrow.

Update - 12:04 (GMT+2):
Lowered my risk. Sl @ 10380.

Update - 11:52 (GMT+2):
Try to play out a possible bearish slingshot on the 15 minutes chart. The momentum configuration got triggered but still needs a nice follow through. On the 5 minutes chart the price action from the daily low looks like a triangle pattern. MA10/20 channel is still intact and MA10 is still a resistance.
DAX30 (CFD) - 15 minutes chart with a possible bearish slingshot setup

10:35 (GMT+2)
DAX31 :) - 15 minutes chart
Opened a dax short just a couple of minutes ago. I put my tp on the Fibo. extension 200.0 level @ 10287. I can't rule out that this is part of a wave [4] correction, because wave [2] was a quick ZZ. So I put my sl near to break even and set a trailing stop on it.

Sunday, September 11, 2016

Weekly review - 09/11/2016

DJI30: 
I will start my review with the my context on DJ30. The weekly chart shows the momentum failed to reach the sustainable bear zone. This tells me that the ATH high is either an end of an impulse wave or rather it's an intermediate degree wave (B) of primary [4] (not shown on the chart).
DJI30 (CFD) - weekly chart
The smaller rectangle drawn up I call it critical structural EWP support zone because this is the limit of a wave c within a flat pattern. So my plan for next week that above this level I will think of this recent price action as part of a flat correction until the market proves it otherwise. If this 1st zone will fail to provide decent support and the smaller corrective channel (shown on the weekly chart) gets broken then I start to think of a trend reversal and anticipating a wave (C) of [4] to unfold (in either an ABC or an impulse structure). My target then will be the next support zone.

DJI30 (CFD) - Daily chart

The momentum of the daily time frame and below nicely set this breakdown. Th RSI on the daily, 4 hours and 1 hour charts pull backed to a level where a breakdown can be anticipated. This break down got confirmed on 1 and 4 hours time frames. It is crucial that the price reach the 161.8 expansion level, which is the minimum requirement for an impulse wave in my reading. If this level gets reached then a small pause (correction) might come, but it is not necessary. This is just a thought so far. I won't dare to change it if the market will throw something else on the table...

DJI30 (CFD) - 4 hours chart

DJI30 (CFD) - 1 hour chart

DAX30:
The market almost reached the top of my target zone with closing candle on Friday night (during the last trading hour of the week a nice bearish slingshot got triggered on the 15 minutes chart).

The weekly and daily chart suggest it is still wiser to consider this drop as part of a range. I can draw up the parallel channel on weekly chart in two ways, but one thing would be the same: the market is at (pierced or at least neared) the higher line of this channel. This channel naturally works as a resistance. So my expectation of a ranging market on this time frames proved to be a good idea. The momentum here still only shows that I can just anticipate a breakdown on these time frames. I need more confirmation for thinking to hit lower targets.
DAX30 (CFD) -weekly chart

DAX30 (CFD) -.daily chart
So right now I only expect that most likely a flat c wave will unfold. The ideal end for wave [3] of c would be at 10350. This is what the most likely scenario in my reading right now based on the 4 hours time frame and below. This 10350 level is also the maximum limit for an ABC pattern too. So above that I can't rule out a different corrective pattern (like a triangle), but below this level at least and impulse c wave can be expected. What's interesting that right now and idealized impulse wave structure would pretty much point to the lower line of a flat pattern corrective channel. I think that during most of the Monday session the MA10/20 channel shown on the 15 minutes chart will behave as resistance and will push the price lower nearing the 10350 level.
DAX30 (CFD) - 4 hours chart
DAX30 (CFD) - 15minutes chart
I can draw up precisely a wave count for an impulse wave from the top on a 4 hours chart, but right now I feel like it would a waist of time. It can be charted as a wave i-ii-[1]-[2], but right now I don't feel the need for charting every little wave, especially because the market is still within the range.

DAX30 (CFD) - 4 hours chart with alternate wave count

NZDUSD: